Documentation

How FolioLize Works

A complete walkthrough of every feature — from your first scan to deep portfolio insights.

1. Scan 2. Overview 3. Data Manager 4. Portfolio Grid 5. Sales Analytics 6. Reports 7. Insights
01

Getting Started

Install the extension & scan your portfolio

FolioLize works through a lightweight Chrome extension that reads your Adobe Stock contributor data directly from your browser — no manual exports, no CSV uploads.

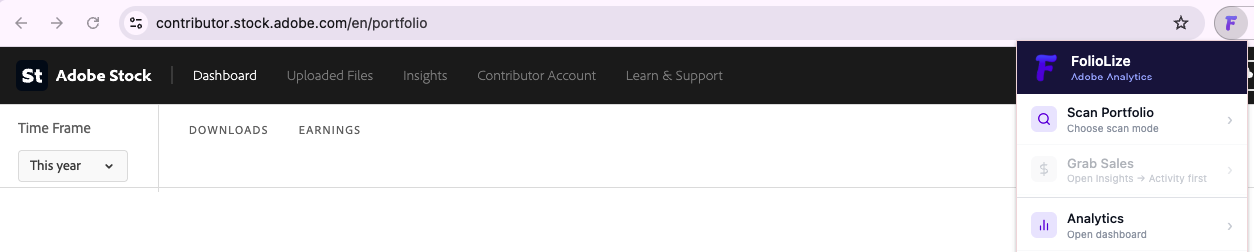
Chrome extension popup
Download & install
Download the latest extension from this site, unzip the folder, then open chrome://extensions, enable Developer Mode, and click Load unpacked — select the unzipped folder.
Open Adobe Stock contributor page
"Scan portfolio" button will be active on page contributor.stock.adobe.com/en/portfolio
Click "Scan" in the extension popup
Go to contributor.stock.adobe.com/en/insights and press "Grab Sales" button. It scans your sales data in the background.
Open Dashboard to Analyze your Data
Once scans done, press "Analytics" to open Dashboard. Data ready to explore.
Privacy note: Your data is processed locally and never stored on our servers. Each scan sends data directly to the analytics engine and immediately discards it.
02

Dashboard

Overview — your portfolio at a glance

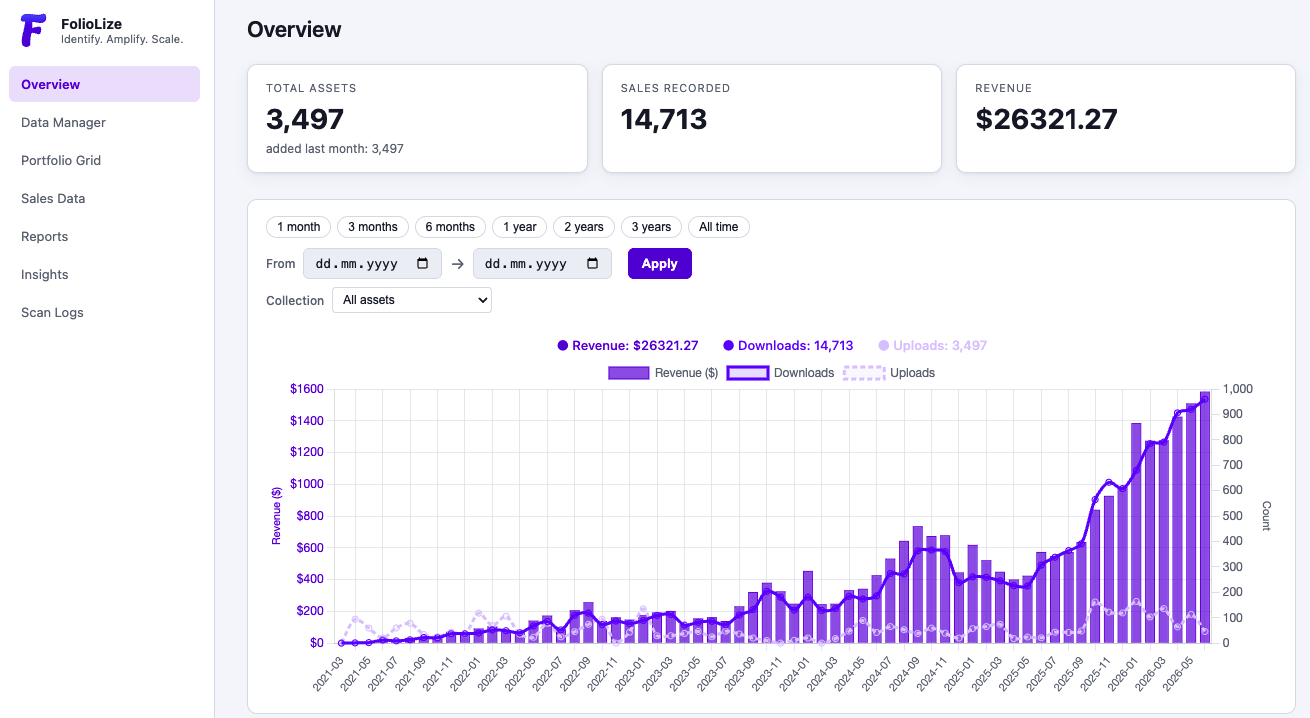
The Overview tab gives you the top-level numbers: total assets, total sales recorded, and revenue — with a chart showing performance over any time period you choose.

Select a date range or collection to dive deeper.

FolioLize Overview dashboard
Total Assets & Sales
See your portfolio size and total sales count instantly at the top of the page.
Revenue chart
Interactive chart showing revenue and downloads over time.
Date range filter
Set a custom date range to analyse any period of your portfolio's history.
Collection filter
Narrow all metrics to a specific collection instead of your full portfolio.
03

Data Manager

Manage and import your sales data

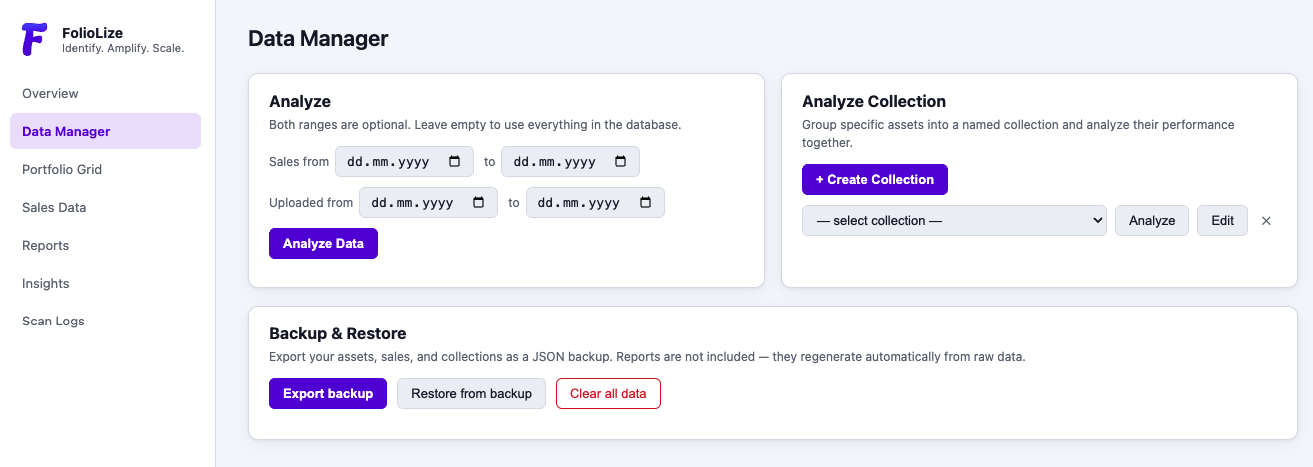
The Data Manager is where you control your raw data. Import sales history, set date ranges for analysis, and export backups of your portfolio data.

Data Manager Tab
Sales import with date range
Set the start and end date for your sales data before scanning to focus on a specific period. Sales range filters when sales happened. Upload range filters which assets are included.
Asset & collection scanning
Separately scan your full asset list and your collections to keep data up to date as you upload new files.
JSON backup export
Export your assets, sales, and collections as a JSON file to keep a local backup or migrate data.
Backup import
Restore a previous backup by importing a JSON file — useful if you switch devices or browsers.
04

Portfolio Grid

Browse and filter every asset

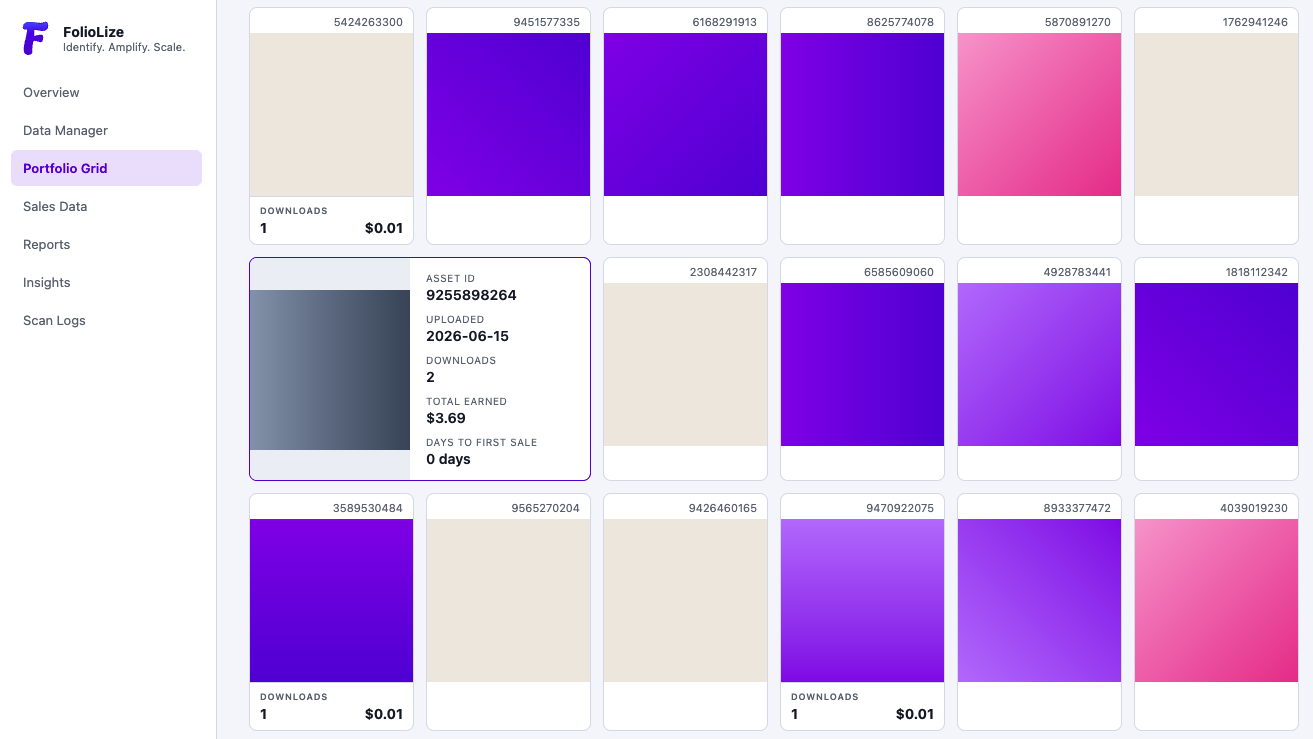
The Portfolio Grid shows all your assets as a visual grid — sortable, filterable, and searchable. Find any asset instantly and see its performance metrics at a glance.

FolioLize Portfolio Grid
Visual asset thumbnails
See all your assets as images with key metrics — sales count, revenue, and upload date visible at a glance.
Sort & filter
Sort by sales, revenue, or date. Filter by file type, collection, or performance range.
Search by keyword or ID
Find any specific asset by searching its title, keyword, or Adobe Stock ID.
Asset detail view
Click any asset to expand its full detail panel — including all sales history and performance metrics.
05

Sales Data

Your imported sales records

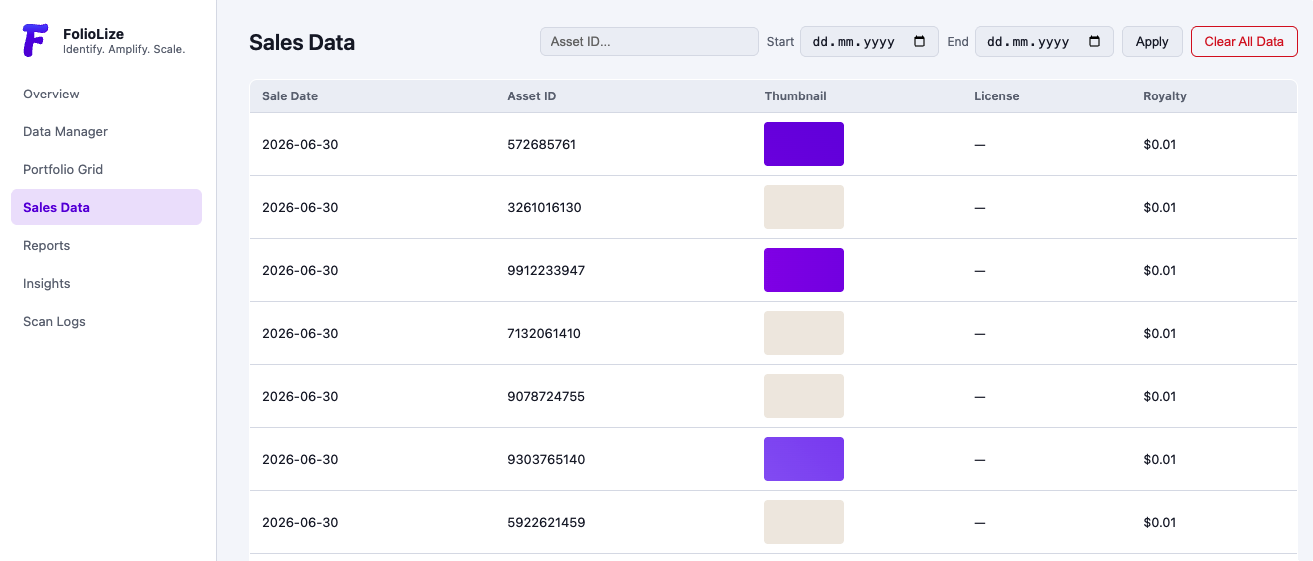
The raw data behind all analytics — every sale imported from Adobe Stock, ready to browse and filter.

Sales Data
06

Reports

Deep-dive reports on demand

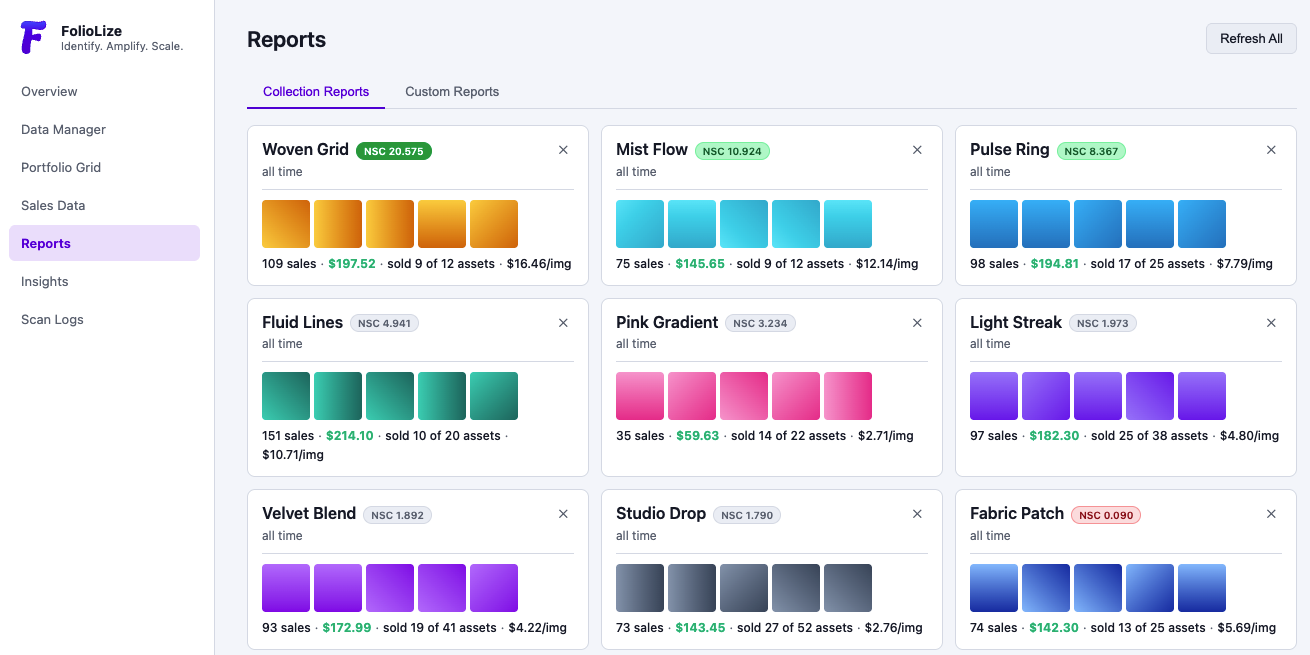
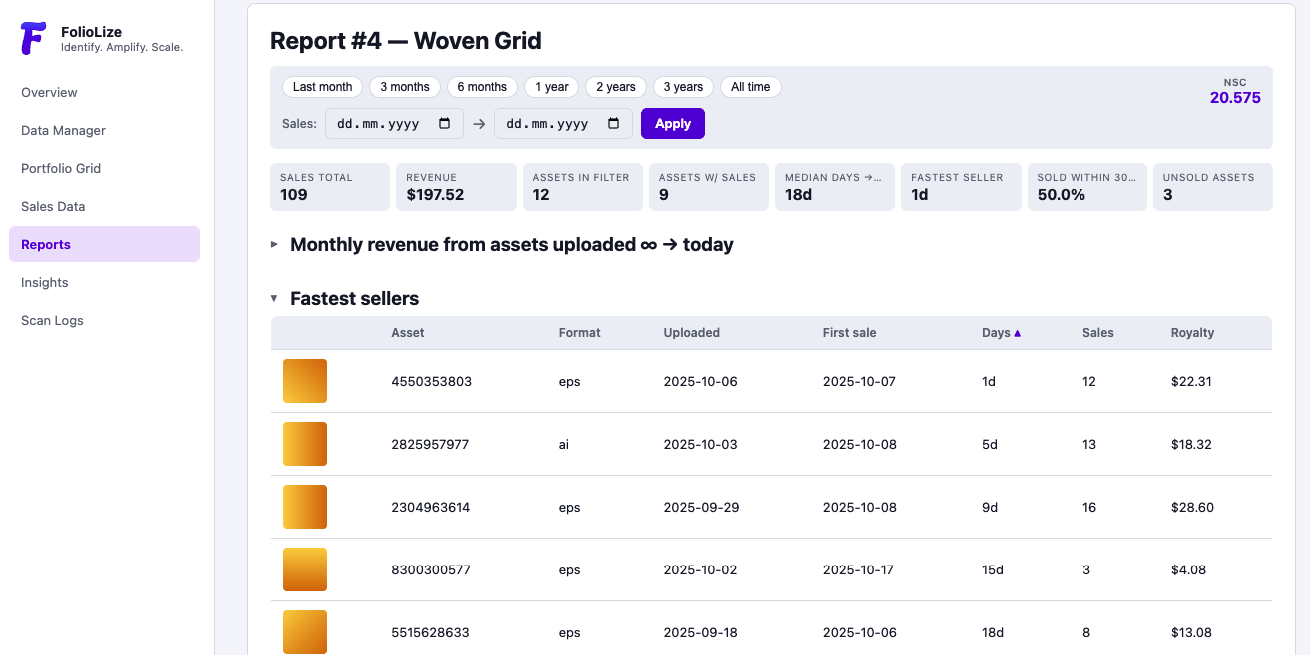
Generate detailed reports filtered by date, collection, or file type. See exactly which assets sold, how fast they sold, and what royalties they generated.

FolioLize Reports
Collection Reports
Generate a report for any specific collection — see all assets, their first sale date, days to first sale, and total royalties.
Fastest sellers
Find assets that sold within 1–5 days of upload — these are your highest-velocity files worth recreating.
NSC — Niche Success Coefficient
NSC is a performance score calculated individually based on your own collections — it compares them against each other to show which niche is working best for you. Every user's coefficient is unique to their portfolio.
What's inside each report
Every report includes: general sales data, monthly revenue breakdown, fastest sellers, assets with no sales, and a full asset list — all scoped to that collection.
FolioLize Reports detail
07

Insights

Actionable intelligence for your next upload

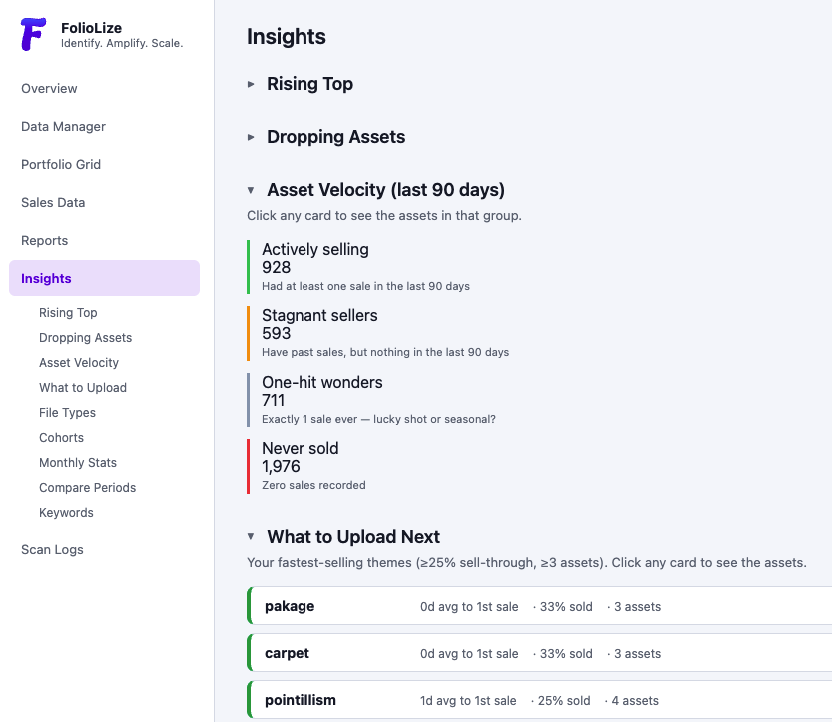
Insights is the most powerful section of FolioLize — 8 dedicated analytics views that tell you what to create, what to stop, and how to grow your portfolio strategically.

FolioLize Insights panel
Rising Top
Assets that are gaining sales momentum — your rising stars worth expanding into a series.
Dropping Assets
Assets with declining sales — helps you identify themes that are losing commercial relevance.
Asset Velocity
How fast each asset sells after upload. High velocity = proven concept worth replicating.
What to Upload
Data-driven recommendations for your next uploads based on your best-performing themes and keywords.
File Types
Performance comparison across all your file formats — find which type brings the highest return.
By Upload Month
Cohort analysis — see how assets uploaded in each month have performed over time.
Compare Periods
Side-by-side comparison of any two time periods — spot growth or decline in your portfolio performance.
Keyword Performance
Which keywords appear most on your best-selling assets — use this to refine metadata on new uploads.
Pro tip: Start with "What to Upload" after your first scan — it gives you an immediate action list based on your existing data.

Ready to see your own data?

Start your 7-day free trial today.